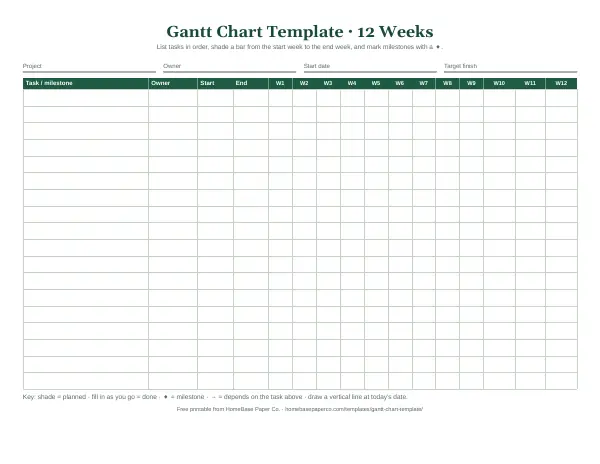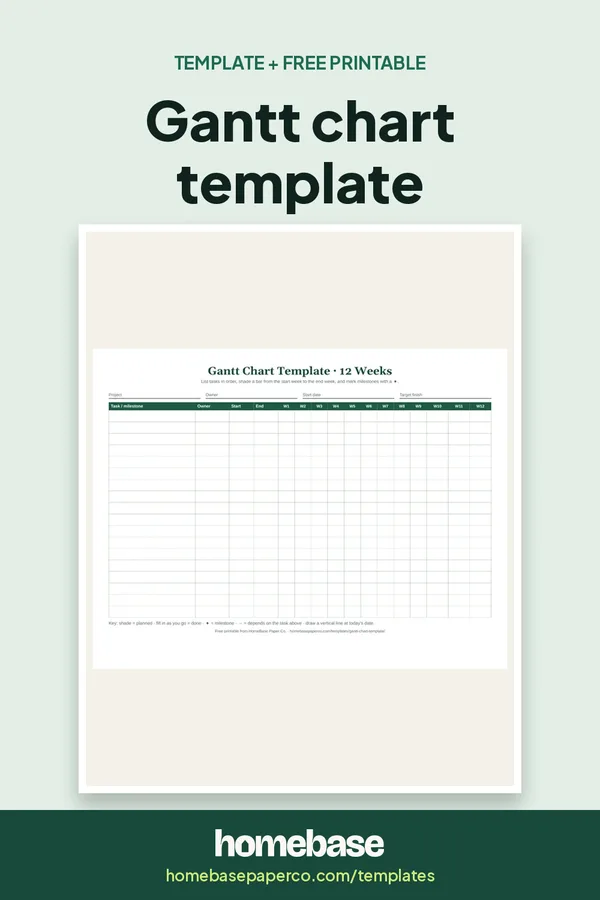
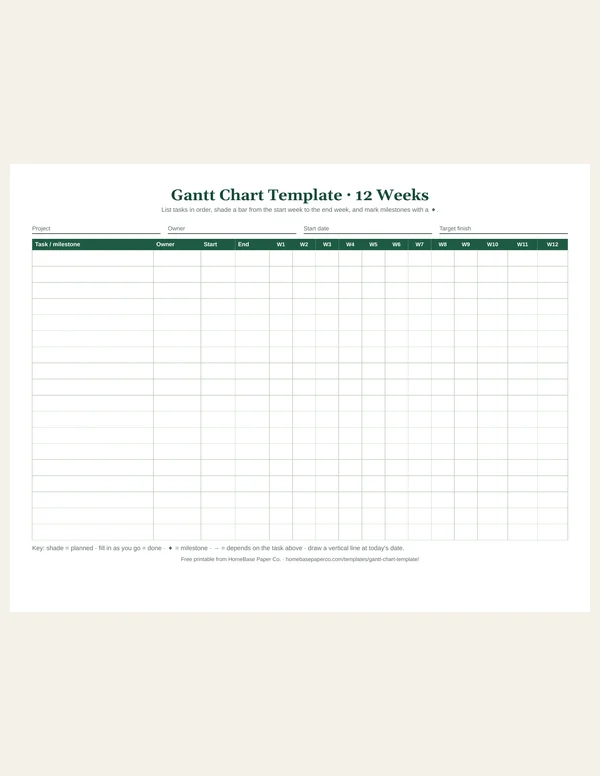
The short answer: A Gantt chart template is a ready-made grid that turns a project into a timeline. Tasks run down the left side, dates run across the top, and each task becomes a bar from its start to its finish, so you can see what happens when, what overlaps and what's falling behind. Our free printable Gantt chart template has two landscape pages: a 12-week chart for short projects and a 12-month chart for long ones.
It's made for small business owners, students, homeowners in the middle of a remodel, event planners and anyone who wants a project plan on one sheet of paper.
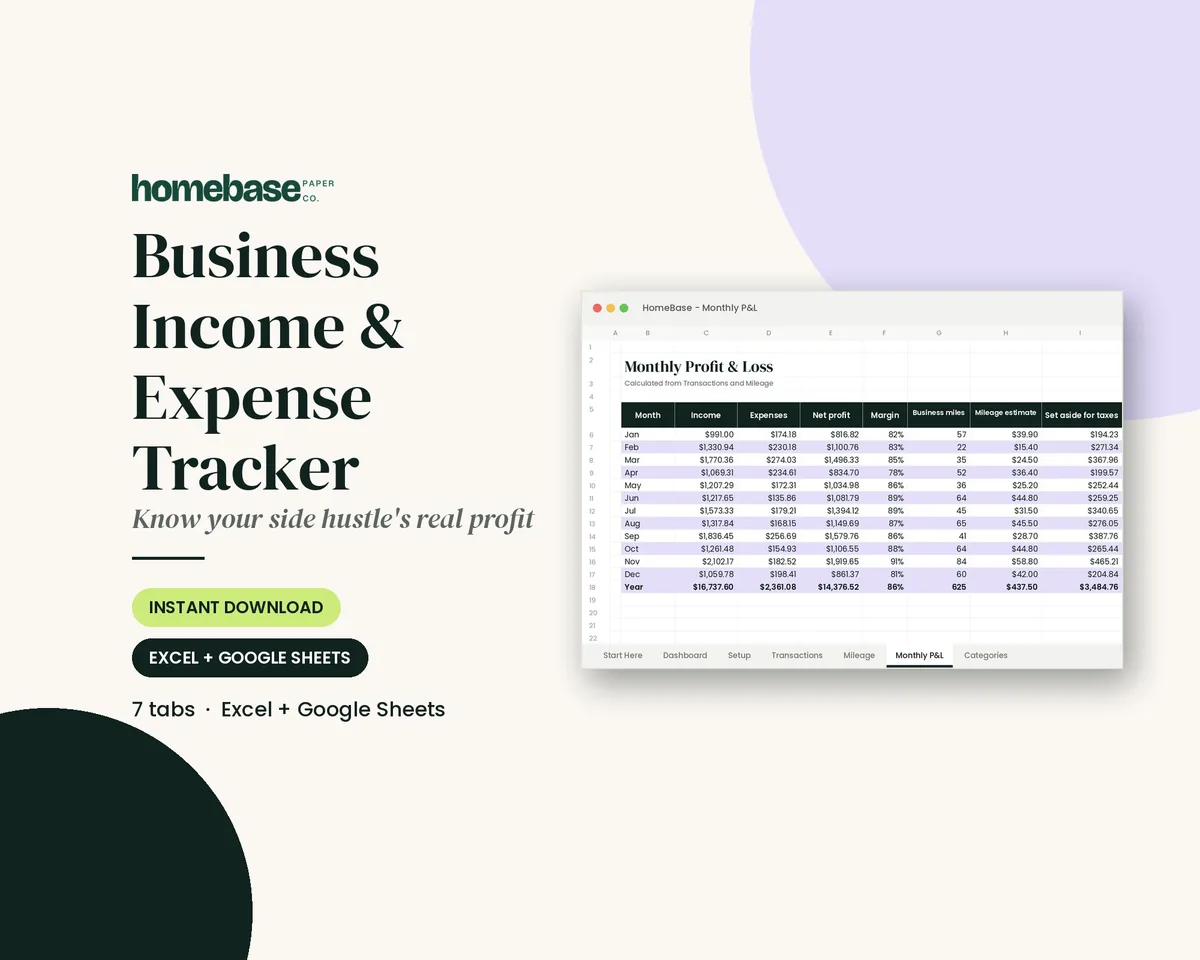
What's included in the Business Income & Expense Tracker
- Start Here guide
- Income & expense log with category dropdown
- Income / expense type fills in automatically
- Monthly profit & loss
- Mileage log with deduction estimate
- Tax set-aside estimate each month
- Year & month totals by category
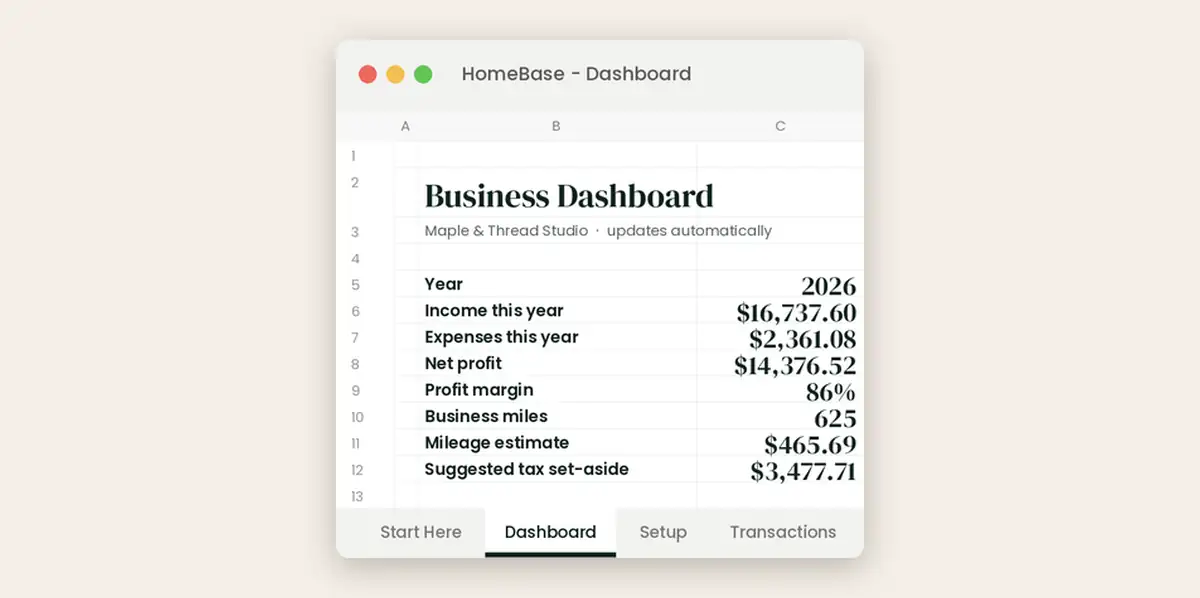
- Dashboard + chart
Spreadsheet (Excel + Google Sheets), $7.99. Instant download; nothing is shipped. See every page on the product page.
Who it's for
- Small business owners planning a launch, a product or a busy season.
- Students and teachers mapping out a group or capstone project.
- Homeowners scheduling a remodel or a list of home projects.
- Event planners working backward from a wedding, party or fundraiser.
- Team leads who want a one-page plan to share in a meeting.
How to fill in a Gantt chart template
- Pick the right page. Use the 12-week page for projects under three months and the 12-month page for longer ones.
- Write the project details. Fill in the project name, owner, start date and target finish at the top.
- List the tasks in order. Write one task per row, in roughly the order they'll happen.
- Add owners and dates. Fill in who is responsible and the start and end date for each task.
- Shade the bars. Shade the timeline boxes from each task's start to its end.
- Mark milestones and links. Draw a diamond for milestones and arrows for tasks that depend on others.
- Update it every week. Fill in progress, draw a line at today's date and move any late bars.
Why use a Gantt chart
A to-do list tells you what needs doing. A Gantt chart also tells you when, for how long, and in what order. The University of South Carolina describes a Gantt chart as a tool for planning and scheduling that shows tasks against time, and the Minnesota Department of Health's quality improvement toolbox recommends a Gantt chart for showing who does what and when.
A paper chart is quick to start, easy to tape to a wall and easy to mark up in a meeting. There's no software to learn and nothing to share or log in to.
What's on the free Gantt chart template
| Page | Timeline | What's included |
|---|---|---|
| 1. 12-week Gantt chart | Weeks 1 to 12 | Project, owner, start and target finish fields, 18 task rows with owner, start and end columns, and a key |
| 2. 12-month Gantt chart | January to December | Project or year, owner, budget and status fields, and 18 task rows with the same columns |
How to make a Gantt chart, step by step
- Define the finish line. Write down what "done" looks like and the date it needs to happen.
- Break the project into tasks. Aim for tasks that take a few days to a few weeks.
- Put them in order. Decide which tasks can run at the same time and which have to wait.
- Estimate each task's length. Be realistic, and add a little buffer to tasks you haven't done before.
- Assign an owner. Every task needs one person responsible, even if several people help.
- Draw the bars. Shade each task from its start to its end date.
- Add milestones. Mark key dates, like a launch or an inspection, with a diamond.
- Track it weekly. Fill in finished work, draw a line at today's date and adjust what's late.
Gantt chart example: a small kitchen refresh
| Task | Owner | Weeks | Depends on |
|---|---|---|---|
| Set budget and choose finishes | Both | 1 to 2 | |
| Get three contractor quotes | Sam | 2 to 3 | Budget |
| Order cabinets and counters | Alex | 4 | Quotes |
| Demo and prep | Contractor | 6 | Delivery date |
| Install cabinets and counters | Contractor | 7 to 8 | Demo |
| Paint and backsplash | Both | 9 | Install |
| Final walk-through ◆ | Both | 10 | Everything |
The same layout works for a business launch, a semester project or the holidays. Planning a busy November and December? Put gift shopping, travel bookings, card mailing and party prep on the 12-week page and you'll see the crunch weeks coming. If you only need events in date order instead of task bars, use a free timeline template.
Tips for a Gantt chart that stays useful
- Keep it to one page. If it doesn't fit, break the project into phases.
- Use pencil for dates. Plans change, and you'll want to move bars.
- Watch the critical path. The chain of dependent tasks sets your finish date. Protect it first.
- Review it at the same time each week. Ten minutes on Monday keeps it honest.
Plan the money and the upkeep too
Most projects have a budget line. The Small Business Income & Expense Tracker ($7.99) tracks income, expenses, mileage and profit with a dashboard that updates as you go. For house projects, the Home Maintenance Log ($5.99) keeps a home improvement log, contractor contacts and seasonal checklists after the Gantt chart is finished.
Ready to use
Track the money and the projects behind the plan
Spreadsheets
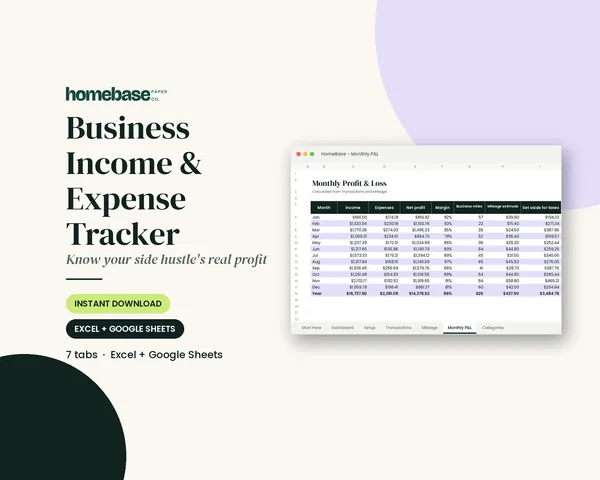
Business Income & Expense Tracker
Log sales, expenses and business miles - see your monthly profit, category totals for tax time and how much to set aside.
Printables
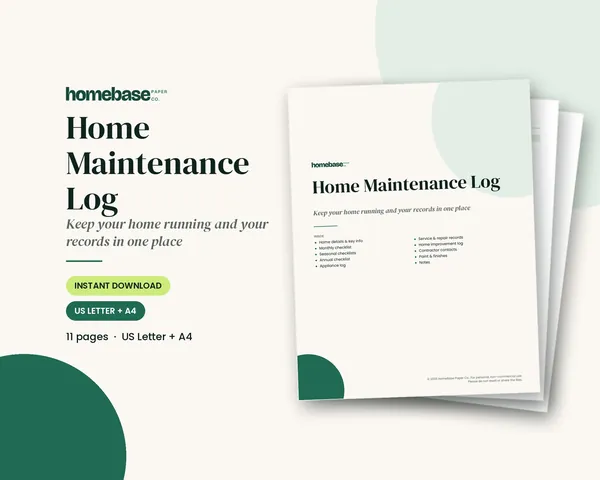
Home Maintenance Log
Monthly, seasonal and annual checklists plus a record of every appliance and repair.
Frequently asked questions
What is a Gantt chart template? A Gantt chart template is a ready-made grid for planning a project over time. Tasks are listed down the left side and dates run across the top, so you draw a bar for each task from its start to its finish. Our free printable Gantt chart template includes a 12-week version for short projects and a 12-month version for longer ones.
How do I make a simple Gantt chart? To make a simple Gantt chart, list every task in the order it needs to happen, then write a start date and an end date for each one. Next, shade the boxes between those dates on the timeline so each task becomes a bar. Mark key milestones with a diamond, and draw arrows between tasks that depend on each other.
What should be included in a Gantt chart? A useful Gantt chart includes the task names, who owns each task, start and end dates, a bar showing each task's duration, milestones, and dependencies between tasks. Many also show progress by filling in part of each bar and a line marking today's date. Our printable template has columns for the task, owner, start and end.
Can I use a Gantt chart for personal projects? Yes, a Gantt chart works well for personal and family projects, not just business ones. People use them to plan a kitchen remodel, a move, a wedding, a holiday season, a garden, a school science fair or a job search. Any project with several steps that overlap or depend on each other gets easier to see on a timeline.
What is the difference between a Gantt chart and a timeline? A simple timeline shows events or milestones as points along a single line. A Gantt chart shows each task as its own bar with a start and an end, so you can see how long each task lasts, which tasks overlap, and which ones have to wait for others. That makes a Gantt chart better for planning and managing work.
How do I show dependencies on a Gantt chart? Show a dependency by drawing an arrow from the end of one task's bar to the start of the task that can't begin until it's done. For example, painting can't start until drywall is finished. Seeing those links helps you spot the critical path, the chain of tasks that sets the earliest possible finish date for the whole project.
How many tasks should a Gantt chart have? Keep a Gantt chart to the tasks you actually need to schedule and track, usually 8 to 25 for a small project. If a task takes less than a day, group it with others into one bigger task. If you need more rows, break the project into phases and use one sheet per phase, with a summary sheet on top.
Who invented the Gantt chart? The Gantt chart is named after Henry Gantt, an American engineer and management consultant who popularized the format in the 1910s to schedule factory work. Earlier versions existed, but Gantt's charts spread widely through manufacturing and later through big projects, and they're still one of the most common project management tools used today.
Free printable
Map a 12-week project on one page
A printable Gantt chart with owners, start and end weeks and milestones. You'll also get our weekly HomeBase email with simple small business paperwork and money tips.