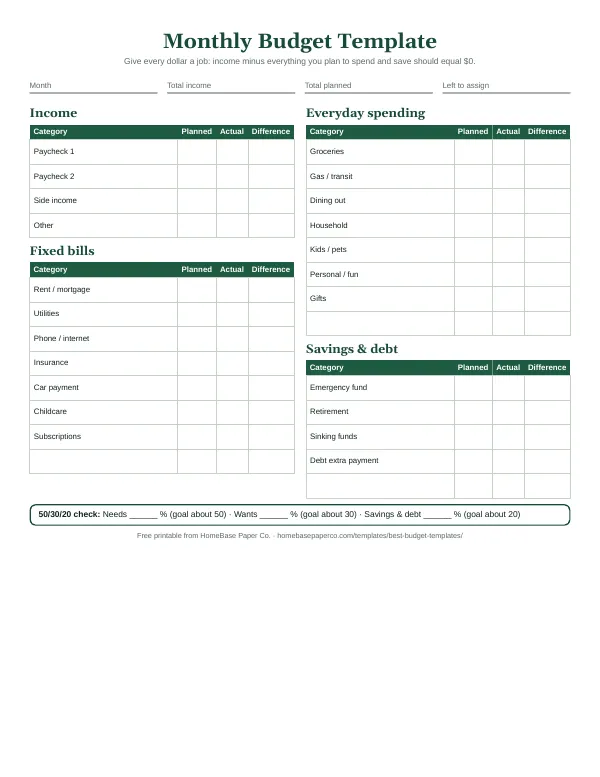
The short answer: good budget percentages, based on take-home pay, are about 25-35% for housing, 10-15% for food, 10-15% for transportation and 10-20% for savings. Pick a spot in each range that fits your life.
- Other ranges: utilities 5-10%, insurance and health 5-10%, debt payments 0-10%, fun and entertainment 5-10%
- Starter split: housing 30%, utilities 6%, food 12%, transportation 12%, insurance and health 7%
- Treat every number as a starting point, not a grade
- Examples at three incomes and what U.S. households really spend are below
- Next step: Plan it with the Annual Budget Spreadsheet ($6.99).
A good set of budget percentages, based on take-home pay, looks like this: about 25-35% for housing, 5-10% for utilities, 10-15% for food, 10-15% for transportation, 5-10% for insurance and health, 10-20% for savings, up to 10% for debt payments, and the rest split between personal, family, giving and fun. Those ranges add up to more than 100%, so you choose a spot in each range that fits your life. Below is the full list by category, a starter version that adds up to exactly 100%, examples at three incomes and what the average U.S. household really spends.
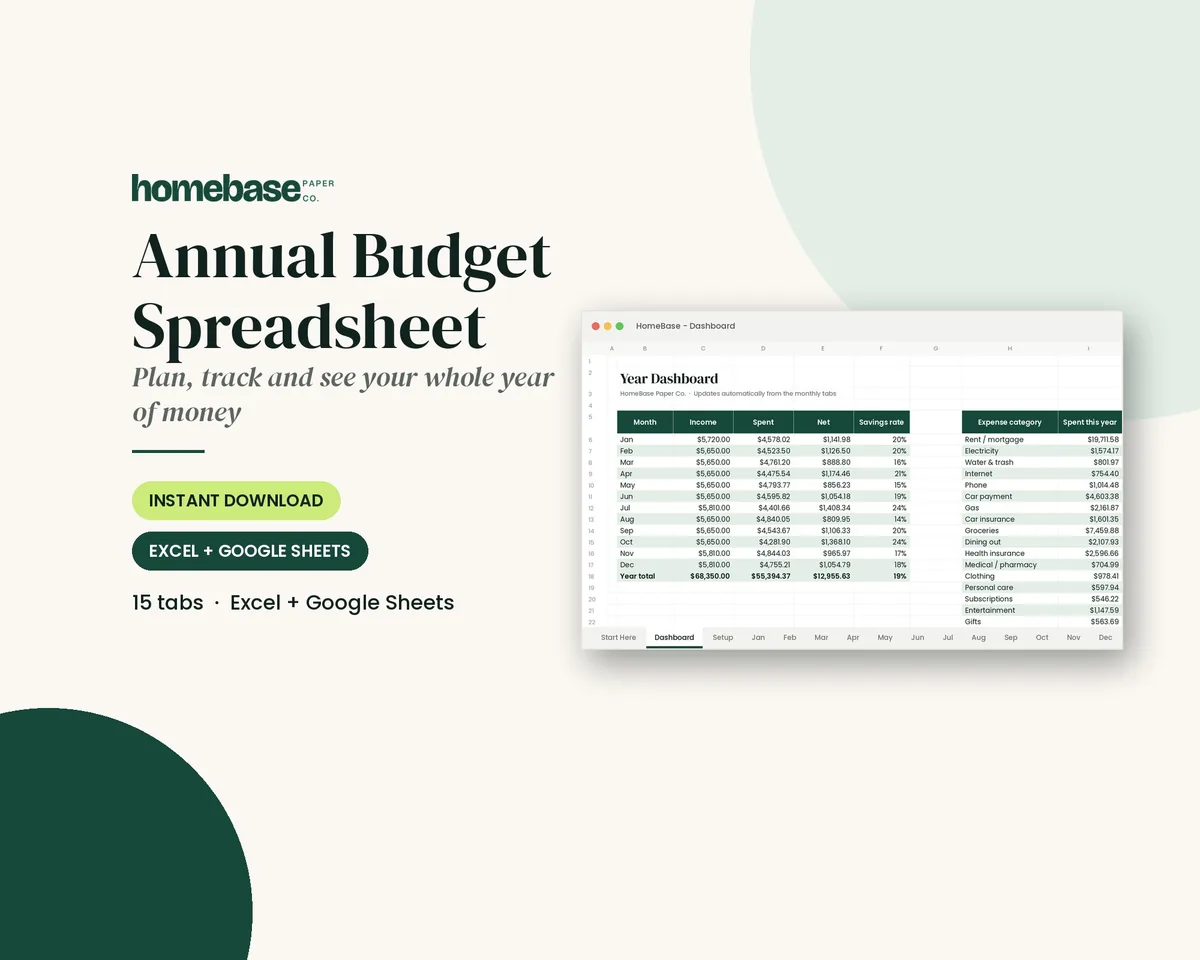
The Annual Budget Spreadsheet ($6.99) tracks planned vs. actual spending by category for all 12 months, so you can see each category's real share of your income instead of guessing.
What budget percentages are (and why they help)
A budget percentage is the share of your income that goes to one category. If you take home $4,000 a month and rent is $1,200, housing is 30% of your budget. That's all it is: category ÷ take-home pay × 100.
Percentages are useful because they travel. A dollar amount that works for one family is useless for another, but "housing is eating 45% of our pay" tells you something no matter what you earn. They also give you a quick way to spot the one or two categories that throw everything else off.
Two ground rules for this guide:
- Use take-home pay (what lands in your account after taxes and payroll deductions). If retirement comes out of your paycheck before you see it, count it toward savings.
- Treat every number as a starting point, not a grade. Your city, family size and debts matter more than any chart.
If you want the simple three-bucket version first, read our guide to the 50/30/20 budget. This page goes one level deeper, category by category.
Recommended budget percentages by category
Here's the big grouped list. Each group shows a typical range as a share of take-home pay, plus what belongs in it. For the full list of line items to choose from, see our budget categories list.
1. Housing: 25-35%
- Rent or mortgage payment
- Property taxes and homeowners or renters insurance (if not in the payment)
- HOA or condo fees
- Basic repairs and maintenance
2. Utilities: 5-10%
- Electric, gas, water, sewer and trash
- Phone and internet
- Streaming only if you count it as a utility (most people put it in fun)
3. Food: 10-15%
- Groceries and household staples
- School lunches and work lunches
- Takeout, restaurants and coffee runs
4. Transportation: 10-15%
- Car payment
- Fuel or charging, car insurance, registration and parking
- Maintenance, tires and repairs
- Bus, train and rideshare
5. Insurance and health: 5-10%
- Health insurance premiums not taken from your check
- Copays, prescriptions, dental and vision
- Life and disability insurance
6. Savings and investing: 10-20%
- Emergency fund
- Retirement contributions
- Sinking funds for irregular costs (car registration, holidays, back-to-school)
- Education savings
7. Debt payments: 0-10%
- Credit card payments
- Student loans
- Personal loans and medical payment plans
8. Personal and family: 5-10%
- Childcare and kids' activities
- Clothing and shoes
- Haircuts, toiletries and personal care
9. Giving: 0-10%
- Church, charity and causes you care about
- Birthday and holiday gifts (or keep these in a sinking fund)
10. Fun and entertainment: 5-10%
- Streaming, hobbies and outings
- Date nights and family days out
- Travel and vacations
11. Miscellaneous buffer: 2-5%
- Small surprises that don't fit anywhere else
- A cushion so one odd expense doesn't break the month
Savings and debt work together. If you're paying down credit cards, debt might take 10% and savings 5% for a while. Once the debt is gone, move that money to savings so the total stays the same.
A starter budget that adds up to 100%
If you'd rather start with one set of numbers, use this. It lands in the middle of each range and adds up to exactly 100% of take-home pay.
| Category | Starter percentage |
|---|---|
| Housing | 30% |
| Utilities | 6% |
| Food | 12% |
| Transportation | 12% |
| Insurance and health | 7% |
| Debt payments | 5% |
| Savings and investing | 15% |
| Personal and family | 6% |
| Giving | 2% |
| Fun and entertainment | 3% |
| Miscellaneous buffer | 2% |
| Total | 100% |
Treat this as your first draft. After a month of real numbers, move a few points between categories until it fits.
Budget percentages in dollars: three examples
Here's the same starter split at three monthly take-home amounts.
| Category | $3,000/month | $5,000/month | $7,000/month |
|---|---|---|---|
| Housing (30%) | $900 | $1,500 | $2,100 |
| Utilities (6%) | $180 | $300 | $420 |
| Food (12%) | $360 | $600 | $840 |
| Transportation (12%) | $360 | $600 | $840 |
| Insurance and health (7%) | $210 | $350 | $490 |
| Debt payments (5%) | $150 | $250 | $350 |
| Savings and investing (15%) | $450 | $750 | $1,050 |
| Personal and family (6%) | $180 | $300 | $420 |
| Giving (2%) | $60 | $100 | $140 |
| Fun and entertainment (3%) | $90 | $150 | $210 |
| Miscellaneous buffer (2%) | $60 | $100 | $140 |
At $3,000 a month, $900 for housing is hard to find in many cities. That's normal. When housing runs high, the money has to come from transportation, fun and savings rather than from the grocery budget. The adjustment section below shows how.
What the average household actually spends
It helps to compare your numbers with real data. The Bureau of Labor Statistics' Consumer Expenditures 2025 release reports that the average household spent $81,905 in 2025. Here's how that spending broke down:
| Category (BLS) | Share of total spending, 2025 |
|---|---|
| Housing (includes utilities, furnishings and household supplies) | 33.9% |
| Transportation | 16.5% |
| Food (at home and away) | 13.0% |
| Personal insurance and pensions (mostly Social Security and retirement) | 12.4% |
| Healthcare | 7.9% |
| Entertainment | 5.0% |
| Cash contributions (giving) | 2.7% |
| Apparel and services | 2.5% |
| Education | 1.9% |
| Everything else | 4.1% |
Three things to notice:
- These are shares of spending, not income. Average income before taxes was $110,847, so the gap includes taxes and anything households saved.
- Housing in the BLS data includes utilities and furnishings. Your 30% housing line plus 6% utilities lines up closely with that 33.9%.
- Transportation is bigger than most people expect. At 16.5%, it's often the second-best place to look for savings after housing.
Is 30% of income for housing still realistic?
The 30% guideline comes from federal housing policy. As the Census Bureau explains in its release on renter households that are cost burdened, HUD considers households cost burdened when they spend more than 30% of income on rent, mortgage payments and other housing costs, and severely cost burdened above 50%. The same release found that 49.7% of renter households paid more than 30% in 2023, so if you're over the line, you have a lot of company.
Two details matter when you use it:
- The 30% guideline is usually measured against gross income. Thirty percent of take-home pay is a stricter target, so don't panic if you're a little over on a take-home basis.
- It's a warning line, not a pass or fail. In high-cost areas, many families pay 35-40%. If that's you, keep transportation, debt and fun lower so the whole budget still works.
How to find your own budget percentages in 6 steps
- Write down your monthly take-home pay. If your income changes, use your lowest normal month.
- Pull last month's spending. Bank and card statements are enough.
- Sort every expense into the categories above. Keep it to 10-15 categories.
- Divide each category by your take-home pay. Multiply by 100 to get the percentage.
- Compare with the ranges. Circle anything far above its range.
- Set next month's targets. Move a few points at a time. Big cuts rarely last.
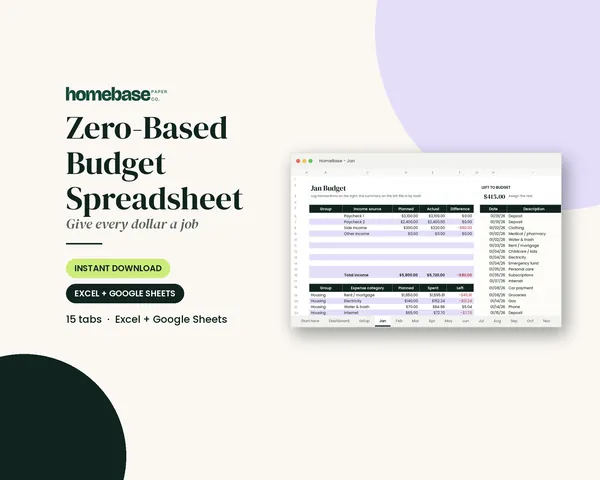
The Zero-Based Budget Spreadsheet ($6.99) has grouped categories (housing, food, saving and more) and a "Left to budget" counter that turns green when every dollar has a job, so your percentages always add up to 100%.
How to adjust the percentages for your life
No chart knows your situation. Here's how the numbers usually shift:
- High-cost city: Housing 35-40%. Trim transportation (one car, transit) and fun, and keep savings at 10% or more.
- Paying off debt: Debt 10-20% until the balances are gone. Fun and personal spending drop to the low end for a season. Our guide to the debt snowball vs. avalanche helps you choose the order.
- Young kids and childcare: Personal and family can jump to 15% or more. Housing, fun and giving usually come down to make room.
- Single income: Build a bigger emergency fund first. The Federal Reserve's Economic Well-Being of U.S. Households in 2025 report found 63% of adults would cover a $400 emergency with cash or its equivalent, so a cushion puts you ahead.
- Irregular income: Base your percentages on your lowest normal month, and put anything extra straight into savings.
- Big earner: Try to raise savings to 20-30% instead of letting housing and lifestyle grow with every raise.
Other budget percentage rules you'll hear about
| Rule | How it splits take-home pay | Best for |
|---|---|---|
| 50/30/20 | 50% needs, 30% wants, 20% savings and debt | A simple first budget |
| 60/20/20 | 60% needs, 20% wants, 20% savings and debt | Higher housing or childcare costs |
| 70/20/10 | 70% living costs, 20% savings, 10% debt or giving | Paying down debt with a set share |
| 80/20 | 80% everything else, 20% savings first | People who hate tracking categories |
All four use the same idea: decide the share first, then spend inside it. The category percentages on this page simply break "needs" and "wants" into smaller pieces you can actually track.
Starter version: if your numbers look scary
If your first look shows housing at 45% and savings at 0%, start smaller:
- Cover the four walls first: housing, utilities, food and transportation.
- Save 1-5%, even if it's $25 a paycheck. The habit matters more than the amount.
- Pick one category to bring down, usually food away from home, subscriptions or fun.
- Revisit the percentages every month. Slow progress is still progress.
For more on where your savings line should land, see how much of your paycheck to save and how to build an emergency fund.
Tools that do the percentage math for you
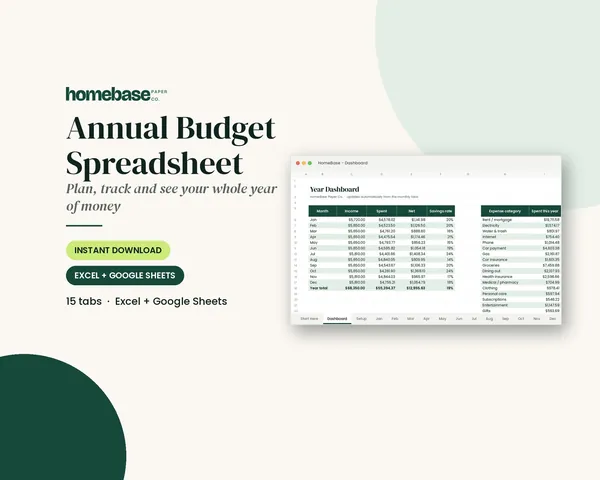
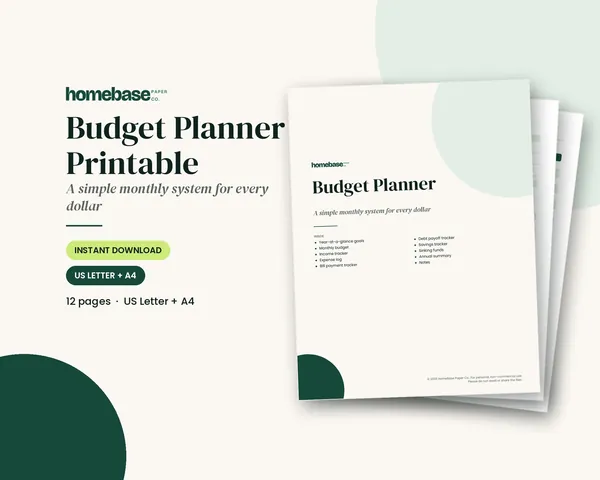
The Annual Budget Spreadsheet ($6.99) starts with a setup tab where you name your categories and plan amounts, then shows planned vs. actual for each category across 12 monthly tabs, with over-budget alerts in red. The Budget Planner Printable ($5.99) gives you the same plan on paper, with budget, bills, spending, savings and debt pages. For irregular costs, the Sinking Funds Tracker ($4.99) works out a monthly amount for each goal.
If you want them all, the Ultimate Budget Bundle has all six budget spreadsheets plus both printable planners for $19.99 (reg. $46.42 bought separately). Browse the full line in our Spreadsheets shop.
This guide is general education, not financial advice. Your best budget percentages are the ones you can keep month after month.
Percentages set the targets; habits keep them. See our budgeting tips for 50 ways to make the numbers hold month after month.
Make it easier
Tools for this
Spreadsheets
Annual Budget Spreadsheet
See exactly where your money goes every month - without complicated software.
Spreadsheets
Zero-Based Budget Spreadsheet
The 'Left to budget' counter turns green when every dollar has a job.
Printables
Budget Planner Printable
Twelve undated pages you can print every month: budget, bills, spending, savings and debt.
Frequently asked questions
What are good budget percentages? Good budget percentages for most households are about 25-35% of take-home pay for housing, 5-10% for utilities, 10-15% for food, 10-15% for transportation, 5-10% for insurance and health, 10-20% for savings and up to 10% for debt, with the rest for personal, giving and fun. Pick a point inside each range so the total comes to 100%.
What are the recommended budget percentages by category? A simple starter split is housing 30%, utilities 6%, food 12%, transportation 12%, insurance and health 7%, debt 5%, savings 15%, personal and family 6%, giving 2%, fun 3% and a 2% buffer. That adds up to exactly 100% of take-home pay, and you can move a few points between categories after your first month of real numbers.
How do I calculate my budget percentages? Divide what you spend in a category by your monthly take-home pay and multiply by 100. For example, $1,200 rent on $4,000 take-home is 30%. The Annual Budget Spreadsheet ($6.99) shows planned vs. actual by category every month, so you can see each category's share without doing the math by hand.
Should budget percentages be based on gross or net income? Use net (take-home) income for a household budget, because that's the money you actually have to spend. Housing affordability guidelines like the 30% rule are usually measured against gross income, so a number that looks high on take-home pay may still be within that guideline. If retirement comes out before your paycheck, count it as savings.
What percentage of income should go to housing? Aim for 25-35% of take-home pay for rent or mortgage, taxes, insurance and HOA fees. HUD considers households that spend more than 30% of income on housing costs to be cost burdened. In expensive areas 35-40% is common, so keep transportation, debt and fun lower to balance it out.
What percentage of my budget should go to food? Most families land around 10-15% of take-home pay for groceries, work and school lunches, and eating out combined. In the BLS Consumer Expenditure data, food was 13.0% of average household spending in 2025. If food runs high, eating out is usually the easiest part to trim.
What percentage of income should I save? Aim to save 10-20% of take-home pay, including retirement, emergency savings and sinking funds. If that isn't possible yet, start with 1-5% and raise it each time a debt is paid off or your pay goes up. The Sinking Funds Tracker ($4.99) tells you how much to set aside each month for every goal.
How much of my budget should go to debt payments? Keep non-mortgage debt payments under about 10% of take-home pay if you can. When you're paying debt down aggressively, it's fine to raise that to 15-20% for a season and lower fun and personal spending. When the debt is gone, move the same amount to savings so the habit continues.
What percentage should transportation be in a budget? Plan on about 10-15% of take-home pay for car payments, fuel, insurance, maintenance and transit. In the BLS 2025 data, transportation was 16.5% of average household spending, the second-largest share after housing. A paid-off car or one less vehicle is often the biggest single saving in a budget.
Is the 50/30/20 rule the same as budget percentages? The 50/30/20 rule is one set of budget percentages: 50% of take-home pay for needs, 30% for wants and 20% for savings and debt. Category budget percentages break those three buckets into smaller lines like housing, food and transportation. Our 50/30/20 budget guide covers the three-bucket version step by step.
What if my housing costs are more than 35% of my income? High housing costs mean other categories have to come down, not that your budget is broken. Trim transportation, fun and personal spending first, keep at least a small savings line, and revisit housing when your lease ends or your income changes. The Zero-Based Budget Spreadsheet ($6.99) helps you rebalance so every dollar still has a job.
How often should I review my budget percentages? Check your budget percentages once a month and do a bigger review every few months or after a life change like a new job, a move or a new baby. Monthly reviews catch small drifts, like food creeping up, before they turn into a problem. The Budget Planner Printable ($5.99) has undated monthly pages so you can start any month.
Is there a budget template that shows percentages by category? A budget template that tracks planned vs. actual by category works well for percentage budgeting: the HomeBase Annual Budget Spreadsheet ($6.99) lets you set your own categories and plan amounts, then tracks planned vs. actual across 12 months with a year dashboard. The Ultimate Budget Bundle ($19.99, reg. $46.42) includes it with all six of our budget spreadsheets and both printable planners.
More from HomeBase
You may also like
Spreadsheets
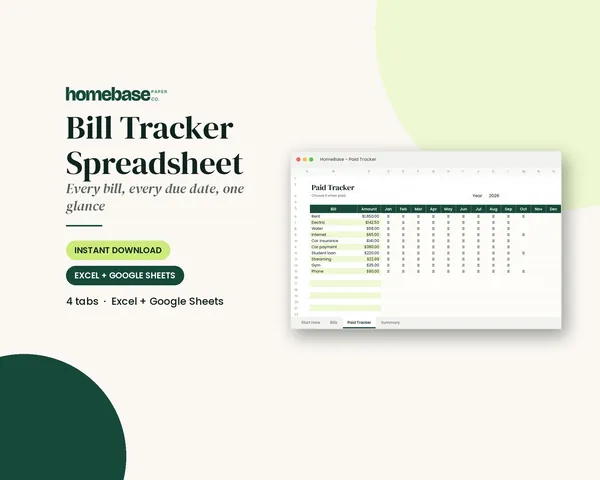
Bill Tracker Spreadsheet
Bills due in 3 days or less light up red, so nothing slips through.
Spreadsheets
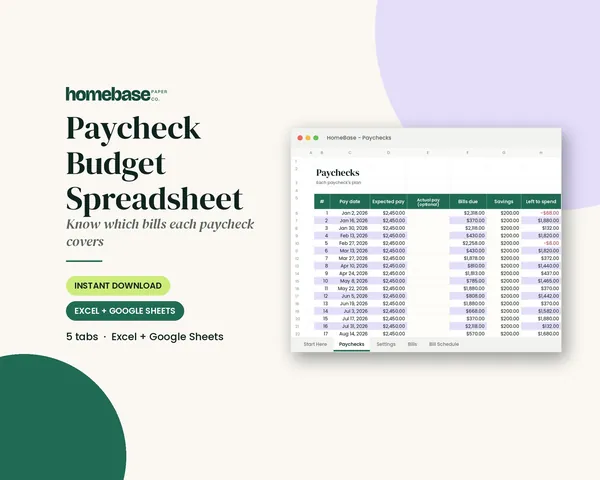
Paycheck Budget Spreadsheet
Enter your bills once. The sheet tells you which paycheck pays each one, all year.
Spreadsheets
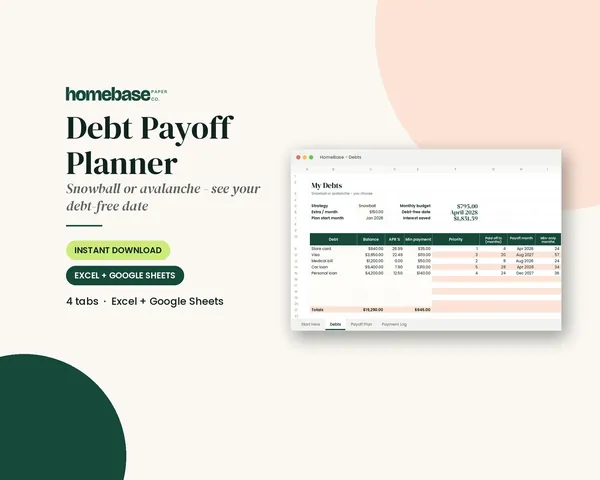
Debt Payoff Planner
Pick snowball or avalanche, add any extra payment, and get your debt-free month instantly.
 Starter pick
 Club
Monthly club
Money Club
Anyone who wants a clear plan for the month's bills, holiday spending and savings.
Free printable
Give every dollar a job: get the free monthly budget template
A printable zero-based monthly budget: income, bills, everyday spending and savings on one page, with a planned vs. actual column. You'll also get our weekly HomeBase email with simple budgeting and bill-paying tips.