
The short answer: the 2026 tax brackets are 10%, 12%, 22%, 24%, 32%, 35% and 37%. For a single filer, 10% covers the first $12,400 of taxable income and 37% starts above $640,600. For married couples filing jointly, those cutoffs are $24,800 and $768,700.
- How it works: each rate hits only the slice of income inside its bracket. A single filer with $60,000 in wages pays about $5,020, an 8.4% effective rate, not 12% of everything.
- 2027: same seven rates. The IRS hasn't posted the 2027 ranges yet; estimates put the single 10% bracket at about $12,800.
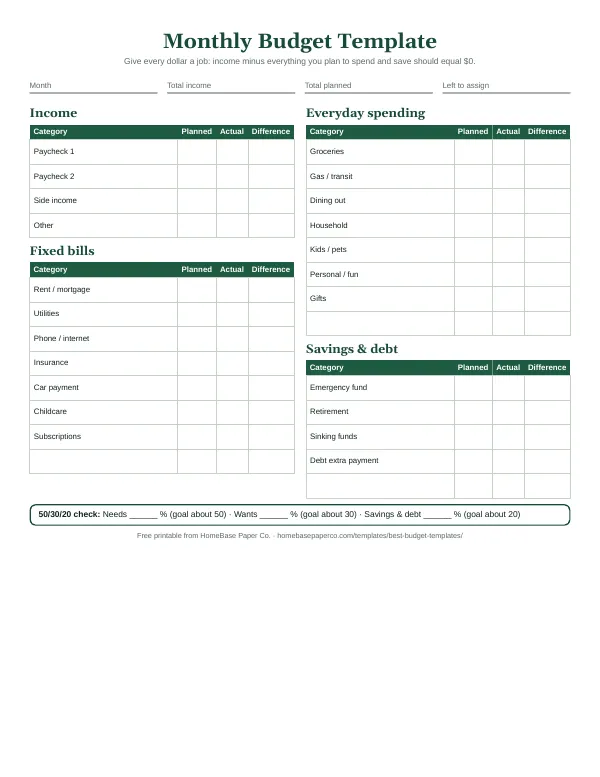
- Free download: get the free monthly budget template (we email it to you) to plan around your take-home pay. To track a full year of income and savings, the Annual Budget Spreadsheet is $6.99.
Checked November 4, 2026, against IRS Revenue Procedure 2025-32 and the IRS 2026 inflation adjustment release. Below: 2026 bracket tables for all four filing statuses, the tax-owed formula, worked examples, 2025 vs. 2026 changes, the 2027 outlook, capital gains brackets and the moves that lower your taxable income.
2026 federal income tax brackets by filing status
These are the official 2026 brackets for tax year 2026, the return you file in early 2027. They come from the IRS 2026 inflation adjustment announcement.
| Tax rate | Single | Married filing jointly | Head of household | Married filing separately |
|---|---|---|---|---|
| 10% | $0 to $12,400 | $0 to $24,800 | $0 to $17,700 | $0 to $12,400 |
| 12% | $12,401 to $50,400 | $24,801 to $100,800 | $17,701 to $67,450 | $12,401 to $50,400 |
| 22% | $50,401 to $105,700 | $100,801 to $211,400 | $67,451 to $105,700 | $50,401 to $105,700 |
| 24% | $105,701 to $201,775 | $211,401 to $403,550 | $105,701 to $201,750 | $105,701 to $201,775 |
| 32% | $201,776 to $256,225 | $403,551 to $512,450 | $201,751 to $256,200 | $201,776 to $256,225 |
| 35% | $256,226 to $640,600 | $512,451 to $768,700 | $256,201 to $640,600 | $256,226 to $384,350 |
| 37% | Over $640,600 | Over $768,700 | Over $640,600 | Over $384,350 |
Surviving spouses use the married filing jointly column. All amounts are taxable income, after deductions, not salary.
Pattern to notice: for single filers, every bracket up through 32% is exactly half of the joint bracket. That's why most married couples don't pay a "marriage penalty" unless they're in the 35% or 37% range.
How to calculate your tax with the brackets
The IRS publishes the 2026 tables in Revenue Procedure 2025-32 as a base amount plus a rate on the excess. Here's that same formula in a quick-lookup form:
| If single taxable income is over | But not over | Your tax is |
|---|---|---|
| $0 | $12,400 | 10% of taxable income |
| $12,400 | $50,400 | $1,240 + 12% of the amount over $12,400 |
| $50,400 | $105,700 | $5,800 + 22% of the amount over $50,400 |
| $105,700 | $201,775 | $17,966 + 24% of the amount over $105,700 |
| $201,775 | $256,225 | $41,024 + 32% of the amount over $201,775 |
| $256,225 | $640,600 | $58,448 + 35% of the amount over $256,225 |
| $640,600 | and up | $192,979.25 + 37% of the amount over $640,600 |
| If joint taxable income is over | But not over | Your tax is |
|---|---|---|
| $0 | $24,800 | 10% of taxable income |
| $24,800 | $100,800 | $2,480 + 12% of the amount over $24,800 |
| $100,800 | $211,400 | $11,600 + 22% of the amount over $100,800 |
| $211,400 | $403,550 | $35,932 + 24% of the amount over $211,400 |
| $403,550 | $512,450 | $82,048 + 32% of the amount over $403,550 |
| $512,450 | $768,700 | $116,896 + 35% of the amount over $512,450 |
| $768,700 | and up | $206,583.50 + 37% of the amount over $768,700 |
| If head of household taxable income is over | But not over | Your tax is |
|---|---|---|
| $0 | $17,700 | 10% of taxable income |
| $17,700 | $67,450 | $1,770 + 12% of the amount over $17,700 |
| $67,450 | $105,700 | $7,740 + 22% of the amount over $67,450 |
| $105,700 | $201,750 | $16,155 + 24% of the amount over $105,700 |
| $201,750 | $256,200 | $39,207 + 32% of the amount over $201,750 |
| $256,200 | $640,600 | $56,631 + 35% of the amount over $256,200 |
| $640,600 | and up | $191,171 + 37% of the amount over $640,600 |
Married filing separately uses the single formula up to $256,225. From there, 35% runs to $384,350, and above that the tax is $103,291.75 + 37% of the excess.
Step by step: find your bracket in 4 steps
- Start with total income: wages, self-employment profit, interest and other income.
- Subtract pre-tax and "above the line" items: traditional 401k deferrals, HSA contributions, a deductible IRA and half of self-employment tax.
- Subtract the standard deduction or itemized deductions, whichever is bigger. In 2026 the standard deduction is $16,100 single, $32,200 joint and $24,150 head of household. See our standard deduction guide.
- Find the result in your filing status column. The row it lands in is your marginal bracket. Then subtract any credits, like the $2,200 child tax credit, from the tax you calculate.
Worked examples: what people actually pay in 2026
These examples use wages only, the standard deduction and no credits. They're our own math using the IRS formulas above.
| Filer | Salary | Taxable income | Federal income tax | Bracket (marginal) | Effective rate on salary |
|---|---|---|---|---|---|
| Single | $40,000 | $23,900 | $2,620 | 12% | 6.6% |
| Single | $60,000 | $43,900 | $5,020 | 12% | 8.4% |
| Single | $100,000 | $83,900 | $13,170 | 22% | 13.2% |
| Single | $150,000 | $133,900 | $24,734 | 24% | 16.5% |
| Head of household | $75,000 | $50,850 | $5,748 | 12% | 7.7% |
| Married filing jointly | $120,000 | $87,800 | $10,040 | 12% | 8.4% |
| Married filing jointly | $250,000 | $217,800 | $37,468 | 24% | 15.0% |
Example in detail: a single filer earns $100,000. Subtract the $16,100 standard deduction and taxable income is $83,900. They pay 10% on the first $12,400 ($1,240), 12% on the next $38,000 ($4,560), and 22% on the last $33,500 ($7,370). Total: $13,170. They're "in the 22% bracket," but only $33,500 of their $83,900 in taxable income, about 40%, is taxed at 22%.
Marginal vs. effective tax rate
- Marginal rate: the rate on your next dollar of taxable income. Use it to judge raises, bonuses, side income and the value of a deduction.
- Effective rate: total tax divided by income. Use it to compare your real tax burden year to year.
The raise myth: a raise never lowers your take-home pay from federal income tax. If a single filer's taxable income goes from $50,000 to $50,900, $400 of the raise is taxed at 12% and $500 at 22%. Federal tax rises by $158, and they keep $742 of the $900 before payroll taxes.
Deduction math: a $1,000 deduction saves $220 in the 22% bracket but only $120 in the 12% bracket. A $1,000 credit saves $1,000 either way, which is why credits are worth more.
2025 vs. 2026 tax brackets: what changed
The rates didn't change. The 10% and 12% brackets rose about 4%, and the higher brackets about 2.3%, so the same income can land in a lower bracket. The 2025 figures come from Revenue Procedure 2024-40, for the return most people filed in 2026.
| Rate | Single 2025 | Single 2026 | Joint 2025 | Joint 2026 |
|---|---|---|---|---|
| 10% | Up to $11,925 | Up to $12,400 | Up to $23,850 | Up to $24,800 |
| 12% | Up to $48,475 | Up to $50,400 | Up to $96,950 | Up to $100,800 |
| 22% | Up to $103,350 | Up to $105,700 | Up to $206,700 | Up to $211,400 |
| 24% | Up to $197,300 | Up to $201,775 | Up to $394,600 | Up to $403,550 |
| 32% | Up to $250,525 | Up to $256,225 | Up to $501,050 | Up to $512,450 |
| 35% | Up to $626,350 | Up to $640,600 | Up to $751,600 | Up to $768,700 |
| 37% | Over $626,350 | Over $640,600 | Over $751,600 | Over $768,700 |
Head of household moved from $17,000 to $17,700 at the top of the 10% bracket and from $64,850 to $67,450 at the top of the 12% bracket.
Why the rates stayed put: the 2017 tax law set these seven rates through 2025. The One, Big, Beautiful Bill, signed in July 2025, made them permanent. It also raised the standard deduction and added a $6,000 deduction for people 65 and older for 2025 through 2028.
2027 tax brackets: what to expect
As of November 4, 2026, the IRS hasn't released the 2027 brackets. It usually publishes them in October or November. What we know:
- Rates: the same seven, 10% to 37%. They're now permanent law.
- Ranges: they'll rise with inflation, measured through August 2026.
- Estimates: Bloomberg Tax projects the 2027 thresholds below, a rise of about 3.2%. Treat them as estimates until the IRS confirms.
| Rate | Single 2027 (est.) | Joint 2027 (est.) |
|---|---|---|
| 10% | Up to $12,800 | Up to $25,600 |
| 12% | Up to $52,025 | Up to $104,050 |
| 22% | Up to $109,125 | Up to $218,250 |
| 24% | Up to $208,325 | Up to $416,650 |
| 32% | Up to $264,550 | Up to $529,100 |
| 35% | Up to $661,375 | Up to $793,650 |
| 37% | Over $661,375 | Over $793,650 |
Bloomberg Tax also projects the 2027 standard deduction at $16,600 single and $33,200 joint. Head of household figures follow once the IRS publishes them. We'll swap in the official IRS numbers here once they're released.
2026 capital gains tax brackets
Long-term capital gains (assets held more than a year) and qualified dividends have their own three rates. Short-term gains are taxed at your regular bracket.
| Rate | Single | Married filing jointly | Head of household | Married filing separately |
|---|---|---|---|---|
| 0% | Up to $49,450 | Up to $98,900 | Up to $66,200 | Up to $49,450 |
| 15% | $49,451 to $545,500 | $98,901 to $613,700 | $66,201 to $579,600 | $49,451 to $306,850 |
| 20% | Over $545,500 | Over $613,700 | Over $579,600 | Over $306,850 |
These thresholds use your total taxable income, including the gains. Higher earners may also owe a separate 3.8% net investment income tax.
Other 2026 numbers that change your tax bill
| Item | 2026 amount |
|---|---|
| Standard deduction, single or married filing separately | $16,100 |
| Standard deduction, married filing jointly | $32,200 |
| Standard deduction, head of household | $24,150 |
| Extra standard deduction, 65+ or blind (married) | $1,650 each |
| Extra standard deduction, 65+ or blind (unmarried) | $2,050 |
| Senior deduction, 65+ (2025 to 2028) | Up to $6,000 each, phased out at higher incomes |
| Child tax credit | $2,200 per child ($1,700 refundable) |
| Max earned income tax credit, 3+ children | $8,231 |
| AMT exemption, single / joint | $90,100 / $140,200 |
| Kiddie tax: child's unearned income before parent's rate | $2,700 |
Want the full picture of write-offs? Our tax deductions list covers the common ones, and the tax documents checklist lists what to gather before you file.
Ways to lower your taxable income (and your bracket)
Every dollar you move out of taxable income saves your top marginal rate. These are the common, legal ways to do it.
- Pre-tax 401k or 403b contributions: up to $24,500 in 2026, plus $8,000 at 50+ (see our 401k contribution limits guide for every limit and the projected 2027 numbers). A single filer earning $60,000 who puts in $6,000 saves $720.
- Traditional IRA: up to $7,500 ($8,600 at 50+), deductible depending on income and workplace plan coverage.
- HSA contributions: if you have a qualifying high-deductible health plan, these come off the top too.
- Self-employed deductions: business expenses, the home office and mileage cut the profit your bracket applies to. See our small business tax deduction checklist and mileage log guide.
- Bunching deductions: if you're close to the standard deduction, grouping two years of charitable gifts into one year can push you over it to itemize.
- Tax-gain harvesting: if your income falls in the 0% capital gains range, selling and rebuying winners can reset your cost basis with no federal tax.
For the retirement side of this, see how to save for retirement and our Roth IRA guide. A Roth doesn't lower this year's bracket, but it can lower your bracket in retirement.
Withholding, quarterly taxes and your paycheck
Your employer withholds federal income tax each paycheck based on your W-4. Brackets set how much you owe for the year; withholding is just the prepayment.
- W-2 employees: if you owed a lot last April, or got a huge refund, update your W-4. Our guide on how to read a pay stub shows where federal withholding appears.
- 1099 workers and side gigs: nobody withholds for you, so you pay quarterly. See how to pay quarterly taxes and 1099 vs. W-2.
- Payroll taxes are separate: Social Security (6.2%) and Medicare (1.45%) come out regardless of bracket. More in how Social Security works.
- State taxes: most states have their own income tax. Some use brackets, some a flat rate, and a few have none.
The IRS explains the bracket system in plain terms on its federal income tax rates and brackets page.
Tools to plan your taxes all year
Taxes are easier when your income, savings and deductions live in one place all year, not in a shoebox in April.

- Annual Budget Spreadsheet, $6.99: a 12-month Google Sheets template (it works in Excel too) for income, bills and savings. See your yearly totals before December and decide whether a bigger 401k deferral makes sense.
- Business Income & Expense Tracker, $7.99: for freelancers and side businesses. Log sales, expenses and miles, and see monthly profit and tax-time totals.
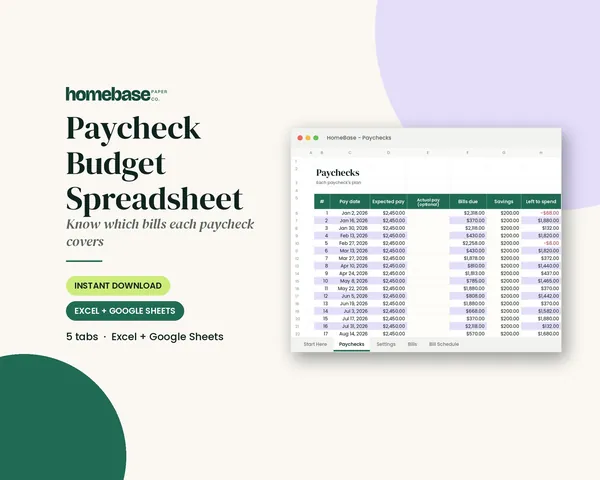
- Paycheck Budget Spreadsheet, $5.99: see which paycheck pays each bill after taxes come out.
- Ultimate Budget Bundle, $19.99 (
$46.42bought separately): all six budget spreadsheets plus both printable planners.
Browse all budget spreadsheets, printable planners or money bundles.
The bottom line
The 2026 tax brackets keep the same seven rates, from 10% to 37%, with income ranges 2% to 4% higher than in 2025. Brackets apply to taxable income in layers, so a raise always leaves you with more money, and your effective rate is far lower than your bracket. Use the tables above to find your bracket. Then lower your taxable income with pre-tax savings and deductions, and check back for the official 2027 brackets once the IRS releases them.
Make it easier
Tools for this
Spreadsheets
Annual Budget Spreadsheet
See exactly where your money goes every month - without complicated software.

Spreadsheets
Business Income & Expense Tracker
Log sales, expenses and business miles - see your monthly profit, category totals for tax time and how much to set aside.
Spreadsheets
Paycheck Budget Spreadsheet
Enter your bills once. The sheet tells you which paycheck pays each one, all year.
Frequently asked questions
What are the 2026 tax brackets? The 2026 federal tax brackets are 10%, 12%, 22%, 24%, 32%, 35% and 37%. For single filers, 10% covers taxable income up to $12,400 and 37% starts above $640,600. For married couples filing jointly, 10% covers up to $24,800 and 37% starts above $768,700. They apply to returns filed in 2027.
What are the 2027 tax brackets? The IRS had not released the 2027 tax brackets as of November 4, 2026. The seven rates stay the same because the One, Big, Beautiful Bill made them permanent. Bloomberg Tax estimates the single 10% bracket will end at $12,800 and the joint 10% bracket at $25,600, with the official numbers usually out in the fall.
How do tax brackets work? Tax brackets work in layers. Each rate applies only to the slice of taxable income inside that bracket, not to all of your income. A single filer with $43,900 of taxable income in 2026 pays 10% on the first $12,400 and 12% on the rest, for $5,020 in federal income tax.
What tax bracket am I in? To find your tax bracket, subtract your deductions from your income to get taxable income, then find that number in the table for your filing status. A single filer earning $60,000 in wages has $43,900 of taxable income after the $16,100 standard deduction, which puts them in the 12% bracket for 2026.
What is the difference between a marginal and an effective tax rate? Your marginal tax rate is the rate on your last dollar of taxable income, the bracket you're in. Your effective tax rate is your total tax divided by your income. A single filer earning $100,000 in 2026 is in the 22% bracket but pays $13,170, an effective rate of about 13.2% of salary.
Will a raise push me into a higher tax bracket and lower my take-home pay? A raise can push part of your income into a higher bracket, but only the dollars above the threshold get the higher rate. If a single filer's taxable income goes from $50,000 to $50,900 in 2026, only $500 is taxed at 22%, and federal tax rises by just $158 on the $900 raise.
What is the standard deduction for 2026? The 2026 standard deduction is $16,100 for single filers and married filing separately, $32,200 for married couples filing jointly and $24,150 for heads of household. Filers 65 or older or blind add $1,650 each if married, or $2,050 if unmarried. You subtract it before using the tax brackets.
What are the 2026 capital gains tax brackets? Long-term capital gains are taxed at 0%, 15% or 20% in 2026. The 0% rate applies up to $49,450 of taxable income for single filers, $98,900 for joint filers and $66,200 for heads of household. The 20% rate starts above $545,500 single, $613,700 joint and $579,600 head of household.
Did the tax brackets change for 2026? The seven rates did not change for 2026, but the income ranges rose: about 4% for the 10% and 12% brackets and about 2.3% for the higher ones. The single 10% bracket went from $11,925 in 2025 to $12,400 in 2026, and the joint 10% bracket from $23,850 to $24,800. The One, Big, Beautiful Bill kept the 2017 rates permanently instead of letting them expire.
Are tax brackets based on gross income or taxable income? Tax brackets are based on taxable income, not gross income. Taxable income is your income minus pre-tax deductions like 401k contributions and minus the standard or itemized deduction. That's why someone earning $60,000 in salary is taxed on about $43,900 in 2026 if they take the single standard deduction.
Do tax brackets include Social Security and Medicare tax? Tax brackets cover only federal income tax. Social Security tax of 6.2% and Medicare tax of 1.45% are separate payroll taxes taken from every paycheck regardless of bracket. Most states also have their own income tax with different brackets or a flat rate.
How can I lower my tax bracket? You lower your tax bracket by lowering taxable income. The common ways are pre-tax 401k or 403b contributions up to $24,500 in 2026, a deductible traditional IRA, HSA contributions, and deductions like the new senior deduction. Each dollar you shelter saves your top marginal rate, such as 22 cents in the 22% bracket.
Which HomeBase spreadsheet helps me plan for taxes all year? The Annual Budget Spreadsheet at $6.99 is the best fit. It tracks 12 months of income, bills and savings in Google Sheets or Excel, so you can see your yearly income, pre-tax savings and where you land against the tax brackets before the year ends.
Is there a HomeBase tracker for self-employed income and taxes? The Business Income & Expense Tracker at $7.99 logs sales, expenses and miles in Excel or Google Sheets and shows monthly profit and tax-time totals. Self-employed people can use it to estimate taxable profit, which sets their bracket and their quarterly tax payments.
More from HomeBase
You may also like
Printables
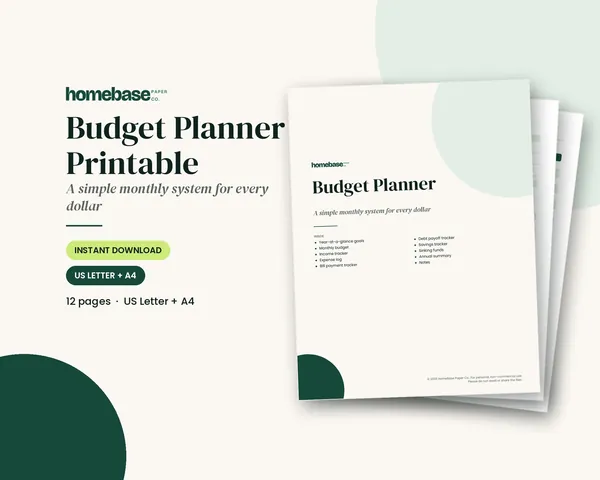
Budget Planner Printable
Twelve undated pages you can print every month: budget, bills, spending, savings and debt.
Spreadsheets
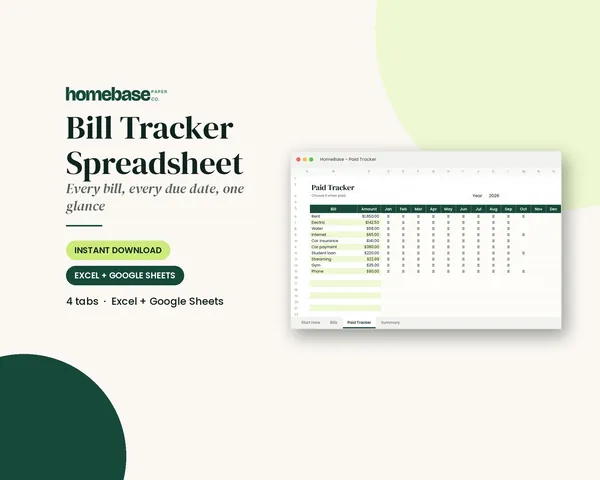
Bill Tracker Spreadsheet
Bills due in 3 days or less light up red, so nothing slips through.

Spreadsheets
Sinking Funds Tracker
It does the math: how much to set aside each month to hit every goal on time.
Spreadsheets
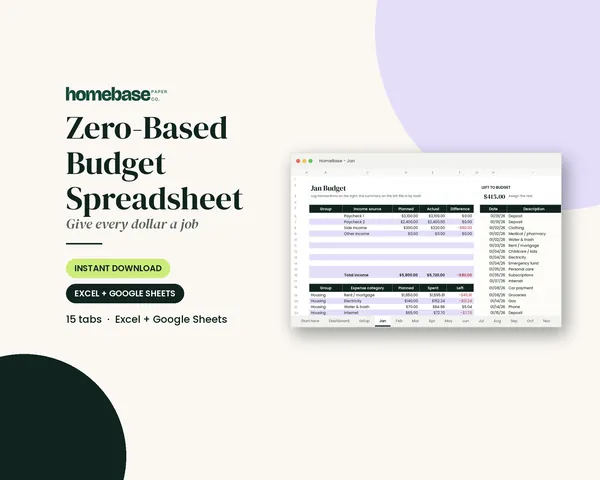
Zero-Based Budget Spreadsheet
The 'Left to budget' counter turns green when every dollar has a job.
 Club
Monthly club
Money Club
Anyone who wants a clear plan for the month's bills, holiday spending and savings.
Free printable
Give every dollar a job: get the free monthly budget template
A printable zero-based monthly budget: income, bills, everyday spending and savings on one page, with a planned vs. actual column. You'll also get our weekly HomeBase email with simple budgeting and bill-paying tips.